Monitoring the Stack
For performance metrics, Self Managed Prefect uses Prometheus store and exporters to surface these statistics. Prometheus is a time series database and metric aggregator, which can in turn be viewed through another common tool such as Grafana.
The main sources of statistics that are exported, aggregated and displayed:
PostgreSQL is monitored through an open-source pgExporter for database metrics. CloudWatch Exporter (AWS) is used to surface CloudWatch Metrics for the RDS host, the Load Balancers, and Redis/Elasticsearch. * Cluster level metrics are available natively through the default Prometheus operators.
Cluster Overview
This dashboard is dedicated to visualize infrastructure metrics (cpu, memory, network, disk) and the state of pods/containers.
You can change the time range for the metrics in the top right corner, currently the retention period is 5 days. Note that rows are collapsing and there are dropdown menus in the top left corner. For some panels, e.g. Pod CPU/memory, you have to choose pods from the dropdown menu 👇.
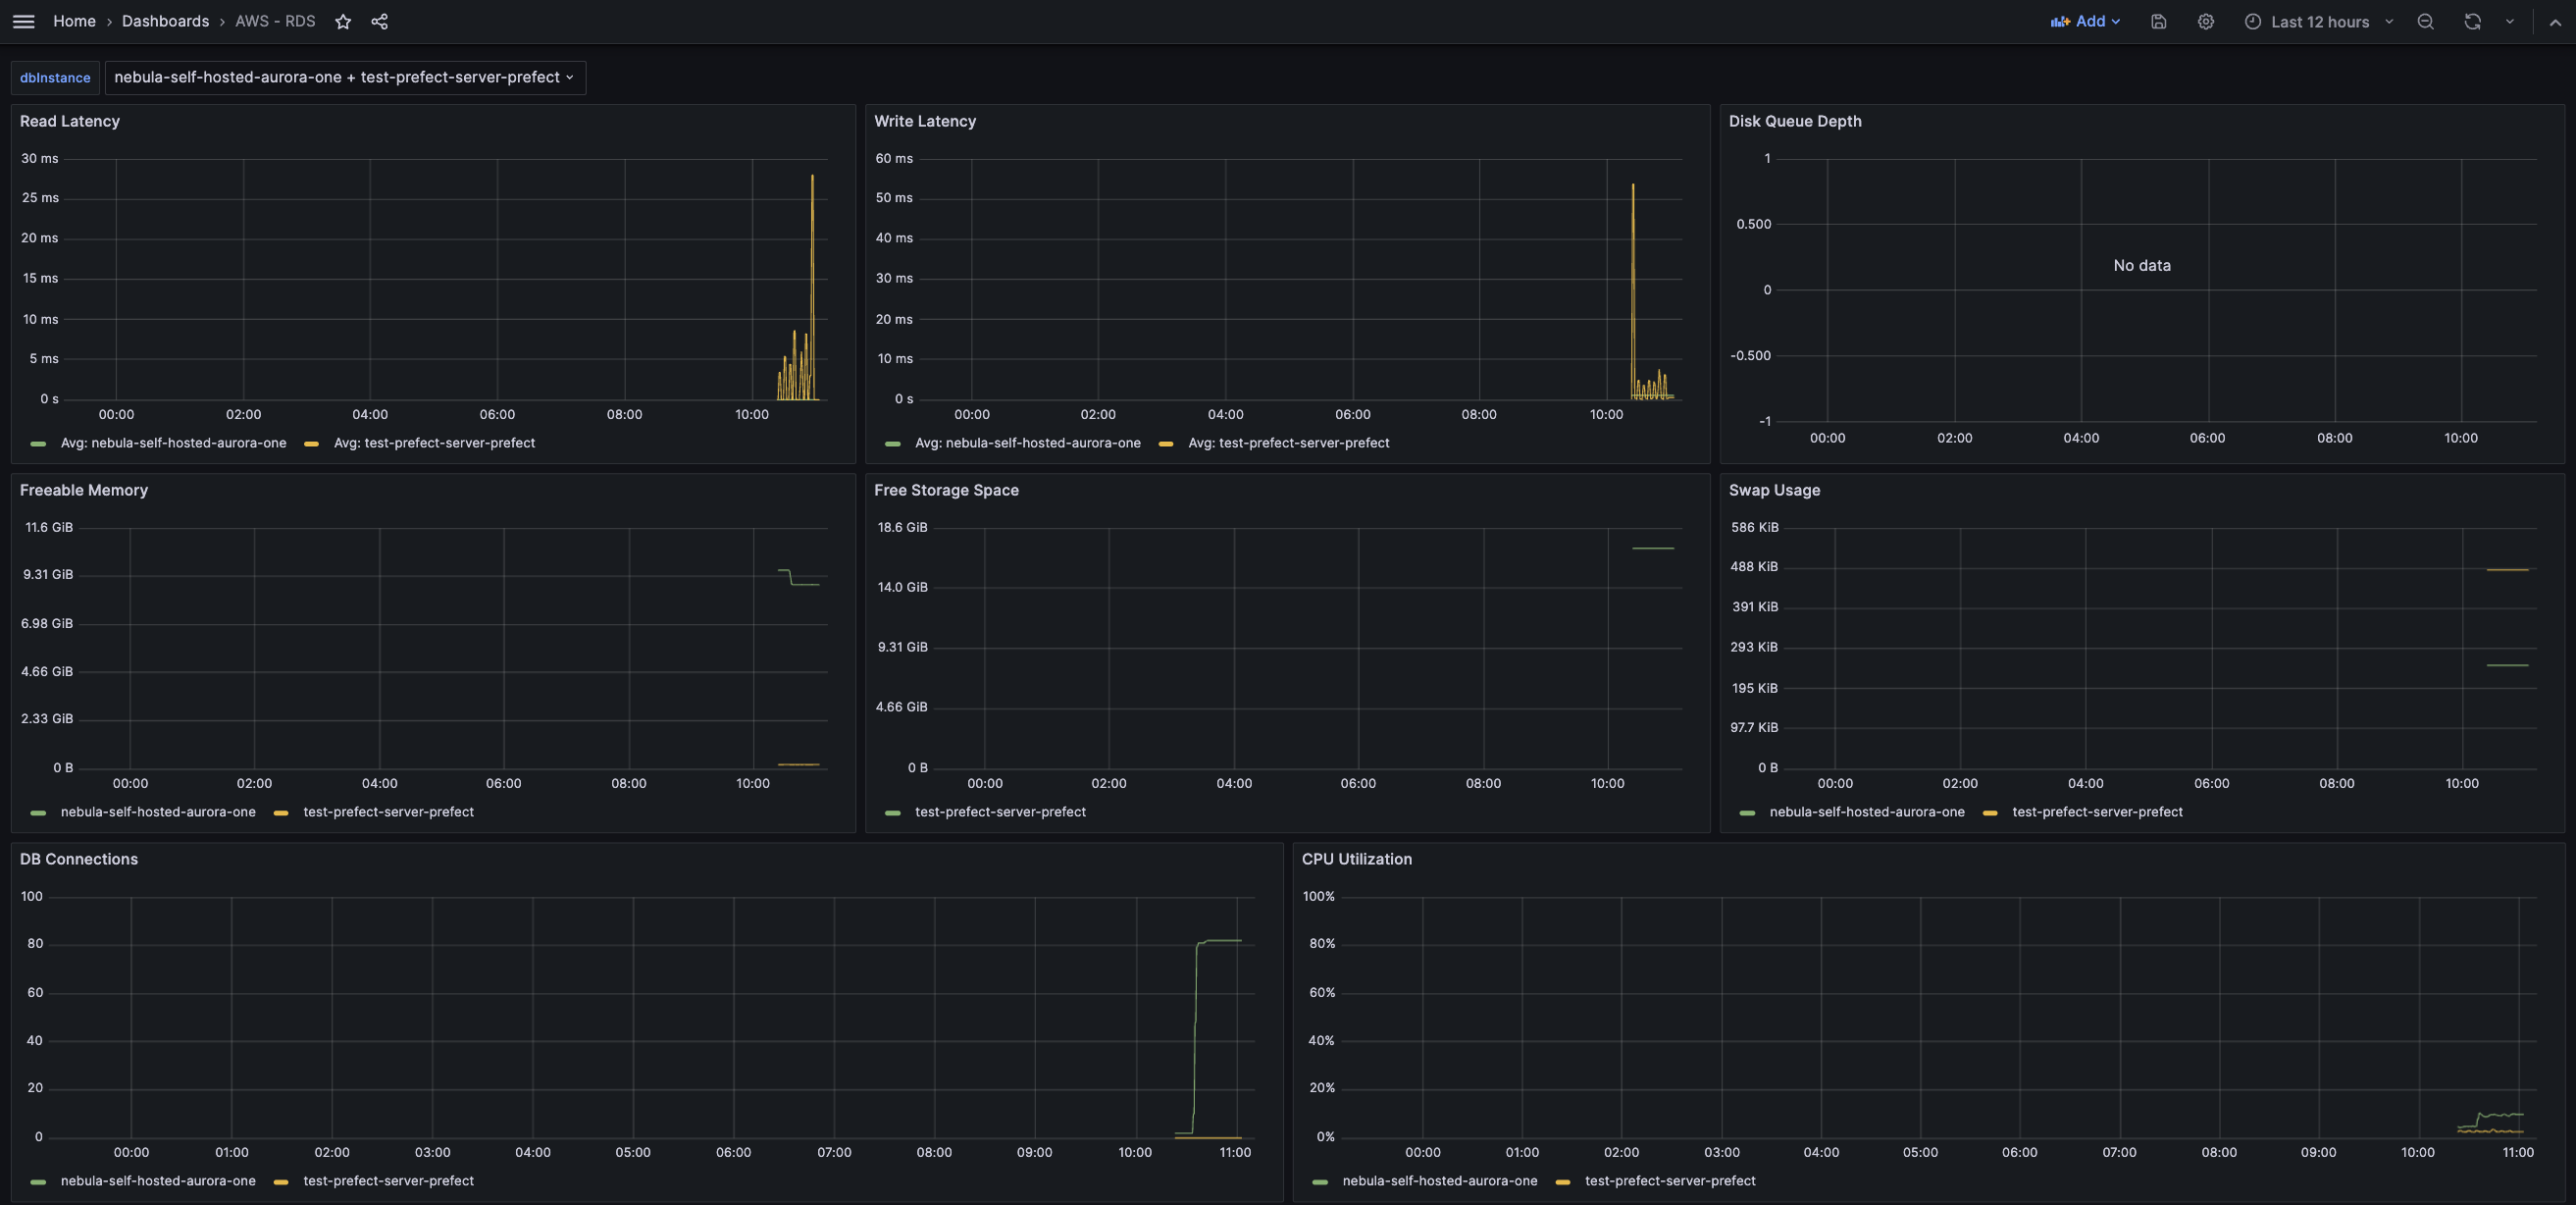
AWS RDS
This dashboard exposes database metrics. It consumes 2 datasources: AWS CloudWatch is for compute metrics on the host, and PostgreSQL exporter for database metrics.
Rows Info:
-
Rows Updated
The number of rows updated.
You can get a query for total number of rows updated from pg_stat_user_tables:
SELECT current_database() datname, schemaname, relname, n_tup_upd FROM pg_stat_user_tables; Which will give you a total number of rows updated, that’s why we are going to aggregate the data so we can see a rate of change.
-
Rows Inserted
The number of rows inserted.
It’s calculated similar to the rows updated panel and data retrieved from pg_stat_user_tables.
-
Rows Fetched vs Returned for prefect_cloud.
Returned is a number of rows read/scanned.
Fetched is how many rows contained data that was actually needed to execute the query (returned to the user).
Ideally, the number of rows fetched should be close to the number of rows returned (read/scanned) on the database. This indicates that the database is completing read queries efficiently—it is not scanning through many more rows than it needs to in order to satisfy read queries.
If returned more than fetched it indicates that the data may not be properly indexed.
-
Average Rows Fetched / Rows Returned, %
Just a ratio in %. It should be closer to 100%.
-
Dead Rows by table
Outdated data can be deleted immediately, but it marked as dead row. VACUUM cleans up a table and removes dead rows eventually. You usually don’t need to think about how and when to execute PostgreSQL VACUUMs at all—the whole process is automatically handled by the database. However, if you are constantly updating or deleting data, vacuuming schedules may not be able to keep up with the pace of those changes. Even worse, vacuum processes may not be running at all, which can lead to a number of side effects that negatively impact database performance and resource usage.
-
Live Rows, top 5
Index Info:
-
Index vs Sequential Scan for table:
: For this panel you have to choose a table (dropdown in the top left corner). Don’t choose tables from hdb_schema.
If you see your database regularly performing more sequential scans over time, its performance could be improved by creating an index on data that is frequently accessed. Running EXPLAIN on your queries can tell you more details about how the planner decides to access the data. Sequential scans typically take longer than index scans because they have to scan through each row of a table sequentially, rather than relying on an index to point to the location of specific rows. However, note that the planner will prefer a sequential scan over an index scan if it determines that the query would need to return a large portion of the table.
-
Top 10 Index Scans
- Top 5 indexes (read)
- Top 5 indexes (fetched)
- Deadlocks
- Rollbacks
- Top 5 tables by size
Prefect Metrics:
- Running task runs by Tenant
- Task run states by Tenant
- Logs by level and Tenant
- Submitted Flow runs by Tenant
- Flow run State for
Choose tenant in the top left corner - Running flow runs for
Compute Metrics:
- Instance state
The current serving state of the host database instance. This can be one of the following:
-
(RUNNING): The instance is expected to be running. If an instance experiences unplanned (non-maintenance) downtime, the state will still be RUNNING, but the database/up metric will report 0.
-
(SUSPENDED): The instance is not available, for example due to problems with billing.
-
(RUNNABLE): The instance has been stopped by owner. It is not currently running, but it's ready to be restarted.
-
(PENDING_CREATE): The instance is being created.
-
(MAINTENANCE): The instance is down for maintenance.
-
(FAILED): The instance creation failed or an operation left the instance in an unknown bad state.
-
(UNKNOWN_STATE): The state of the instance is unknown. Sampled every 60 seconds. After sampling, data is not visible for up to 210 seconds.
-
Memory Utilization
- CPU Utilization
- Disk allocated, disk usage (currently auto increase is enabled in dev)
- Disk read/write IOPS
- Active connections per database
Configuring Monitoring
Configuring monitoring across all components requires several pre-requisities to be successful.
- Helm - For installing the charts
- Prometheus - Core components for monitoring
- Prometheus CloudWatch Exporter - For surfacing Cloudwatch metrics from AWS
- Postgres Exporter - For surfacing database metrics
Additionally, an AWS role/policy with permissions listed below and an associated service account will be necessary to authenticate to the Cloudwatch API.
cloudwatch:ListMetrics
cloudwatch:GetMetricStatistics
cloudwatch:GetMetricData
tag:GetResources
Deploying Prometheus
Installing the Prometheus configuration is the first step. Prometheus is an entire project, application, and platform by itself, so we will only be discussing the requirements necessary to configure for self-hosted.
kubectl create namespace monitoring

helm repo add prometheus-community https://prometheus-community.github.io/helm-charts
helm repo update
helm show values prometheus-community/kube-prometheus-stack
helm install kube-prometheus-stack prometheus-community/kube-prometheus-stack --namespace monitoring
Deploying Cloudwatch Exporter
First create and attach the IAM policy for AWS.
aws iam create-policy \
--policy-name cloudwatch-exporter-policy \
--policy-document file://cloudwatch-exporter-policy.json \
--profile <>
Where the policy will be provided in code, but is shown below:
{
    "Version": "2012-10-17",
    "Statement": [
        {
            "Effect": "Allow",
            "Action": [
                "cloudwatch:ListMetrics",
                "cloudwatch:GetMetricStatistics",
                "cloudwatch:GetMetricData",
                "tag:GetResources"
            ],
            "Resource": "*"
        }
    ]
}
Once the policy has been created in IAM, a service account can be created binding that role:
eksctl create iamserviceaccount \
                --name cloudwatch-exporter-sa \
                --namespace monitoring \
                --cluster prefect \
                --attach-policy-arn arn:aws:iam::<>:policy/cloudwatch-exporter-policy \
                --approve \
                --profile <>
Lastly, the chart can be deployed. A sample / default values.yaml is provided, which retrieves all the necessary metrics from Cloudwatch:
helm install cloudwatch-prom-exporter prometheus-community/prometheus-cloudwatch-exporter -n monitoring -f values.yaml
Deploying pgExporter
There are three separate database instances, which require three separate deployments of the Postgres exporter, one per instance.
The values.yaml files will be additionally provided. Notably, the database connection information is required, either as a complete secret with the connection string, or as host, user, database and password/kubernetes secret.
The ideal configuration is to create an additional Secret Provider Class, and a pod that mounts the secrets in cluster.
This will allow the already deployed secrets driver to sync the database connection strings from Secrets Manager to the monitoring namespace, keeping with security best practices.
helm install prometheus-postgres-exporter-server prometheus-community/prometheus-postgres-exporter -n monitoring -f server_values.yaml
helm install prometheus-postgres-exporter-events prometheus-community/prometheus-postgres-exporter -n monitoring -f event_values.yaml
helm install prometheus-postgres-exporter-nebula prometheus-community/prometheus-postgres-exporter -n monitoring -f nebula_values.yaml
Verifying Prometheus Scrape Targets
Prometheus has a significant amount of configuration to determine what to scrape metrics for.
The "default" out of the box behavior, with no modified configuration is to scrape all ServiceMonitor kinds, which match the label release: <kube-prometheus-stack>.
This can be modified by allowing the configuration to scrape all ServiceMonitors, or applying the release: <label> to any additional targets, or modifying the selector to something more relevant like prommonitored: true.
You can confirm what is actively being selected via:
k get Prometheus -n monitoring -o yaml

# outputs
serviceMonitorSelector:
    matchLabels:
        release: stable # where stable was the name you provided to the helm chart installation for kube-prometheus-stack
If you wish to monitor all ServiceSelectors, without filtering for labels:
serviceMonitorSelector: {}
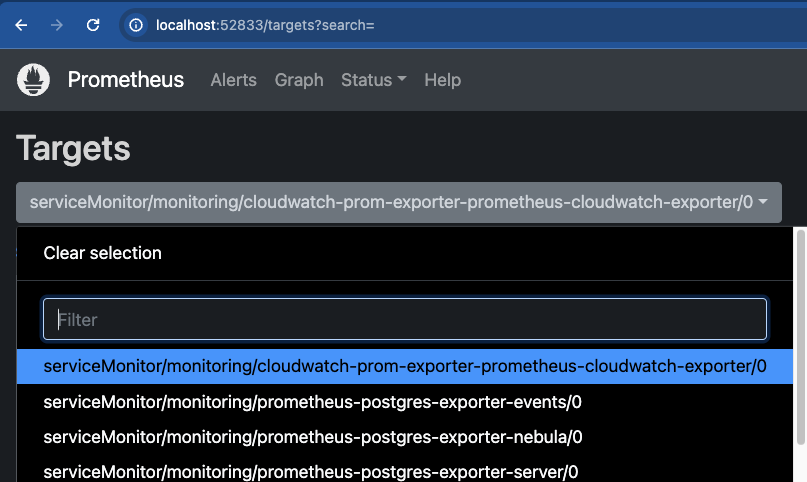
To validate what targets are actively being scraped for, establish a port-forwarding rule into the service prometheus-operated:
kubectl port-forward service/prometheus-operated -n monitoring 9090:9090
Navigate to a web-browser on localhost:9090, select Status -> Targets, and view the drop down menu.
If all service monitors are being properly selected, the following targets should be listed:
cloudwatcheventsnebulaserver
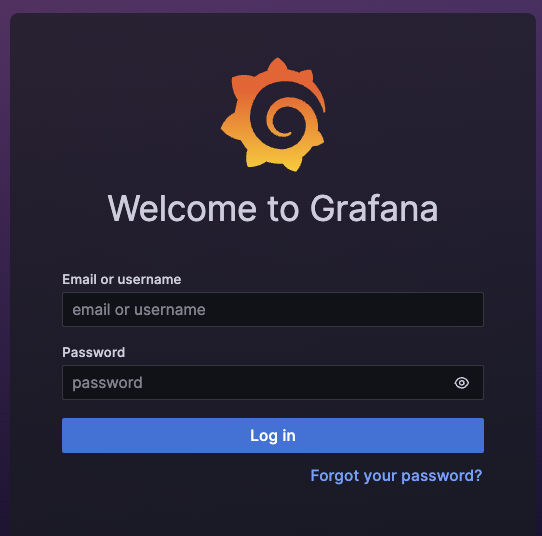
Adding Dashboards to Grafana
To login to Grafana, establish a port-forward to the grafana service:
#stable-grafana might be a different name for your environment, depending on the release name for your helm installation
kubectl port-forward service/stable-grafana -n monitoring 12345:80
The default login for Grafana is admin:prom-operator.
This can be modified by setting the following in your values.yaml when deploying / upgrading your prometheus helm chart:
# https://github.com/prometheus-community/helm-charts/blob/main/charts/kube-prometheus-stack/values.yaml#L952
grafana:
  adminPassword:
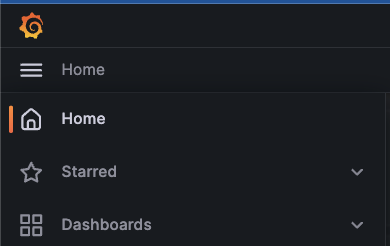
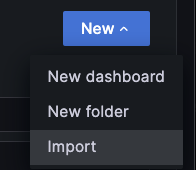
Once logged in, we can select "Dashboards" -> "New" -> "Import". A series of grafana dashboards are provided with this implementation that can be imported. Additionally, as all of the metrics exported are common across environments (being surfaced through Cloudwatch and Postgres), community created public dashboards can also be used - https://grafana.com/grafana/dashboards/.
After importing the db-overview.json, which is a dashboard for visualizing the AWS RDS Cloudwatch Metrics, the following should available.